Chapter X of The Fallacy of Laying Flat
Before we delve into the art and science of how Big Data derives solutions, let’s look at the problem space itself. We err with small data decisions in a Big Data world. As Big Data capability evolves, it should be moving out of the flat into structure. The following classifications evoke the thinking needed to stretch data sets into approaches that provide more productive and realistic decision capability. These ways and means are not being applied today as they could and not progressing as they should be.
Problems have a spectrum of simplicity and entanglement. Figuring out world peace isn’t the same as what’s for dinner. Big Data hasn’t really changed the essence of some of those problems or the schema. Finding a plumber or combating global pandemic is still a slate of options and contingencies, just with more information.
Big Data though provides so much information that it needs to be interpreted differently than the ways we have previously used small data. The data sets are not just exponentially larger; they are continuous and “always on”. They cost less to capture and process; they’re not the expensive discrete points of little data. Big Data is variety too – images and videos and texture beyond the characters and digits to which humanity has only been availed previously. The ability to capture and manipulate information is extraordinary. Machines are learning from us and their intelligence artificial – by our hands from our minds.
Big Data doesn’t fit into excel spreadsheets. How we interact and interpret data is both divergent and nascent. We will talk more about what those differences are but for now we’ll break down the problem space into categories of how they occupy mental space. Basically, how we understand a “problem” needs to grow from what standard concepts and practices are now.
The constraints of the physical still cannot be overcome without physical manifestation, but In a Big Data world, that interaction is so much more augmented with information. You still have to jump to catch a moving train but the ability to catch it is much easier, more predictable, repeatable … rapid… with Big Data.
So let’s take a look at this Big Data rendition of examining problems – in four dimensions. The concept is to realize the “space” for decisions in an ever-increasing information world. As we use data more and more naturally, the problems adjust from single and two-dimensional thinking to more robust insight and action. For now perhaps the characters are overwhelming. We ride upon the churning waters of the ocean. The depths below contain mystery, and danger and possibility. We stay afloat by what we can see and feel and touch and by any and all means to survive or gain advantage. Soaring overhead is yet more potential – the ability to fly above it all.
The potential of Big Data is to observe and eventually coalesce the other domains that are tangent and perhaps critical to survival. It starts with one . . .
ONE – A Point in Time
The ONE dimension problem is a single moment. What to have for breakfast? Take or reject a job offer or a new relationship or a moral judgment. The classic scenario is “this or that” – the famous road diverging in a yellow wood. Robert Frost penned an iconic work of literary art in “The Road Not Taken” for choosing one path or another to symbolize the decisions we make in life. Standing at a fork, you can look down either of two roads and ponder what is or isn’t there. Most likely the traveler cannot return so the decision may be lamented afterwards, perhaps years or even a lifetime. Robert Frost knew FOMO well ahead of the Information Age.
A specific pivot point in time, it seems singularly lacking any width or depth of character or choice. Although we usually see the point in time as an either/or solution set, it has potential in an infinite set of choices in any direction. Given the opportunity to stop and derive solutions in place, most likely you can only see a couple of options.
I’d argue though that standing at that point, there are far more than two paths. The traveler could stand still or sit down and wait until something or someone came to assist or order or demonstrate. The traveler could decide not to take a road but instead trounce through the underbrush. Perhaps he or she could even turn around and go the way they came.
A point in time has a solution in multiple – or perhaps infinite – directions. We often shave the choices down to two or three, which is poignant for advancing through the dimensions of problems. In business decision etiquette presenting more than three courses of action usually shows less than thorough research of the issue and a lack of ability to present concise thinking. Perhaps the broader scope of options is too much. Perhaps many of the choices are not even considered consciously or subconsciously because of undesirable effects. Embedded prejudices and experiences alter the frame of acceptable choices. We carve down the infinite set into tangible options from learned experience, which is often good but not always. We also eliminate what we don’t see.
Keep these limitations in mind as we step further into the TWO dimension problem.
TWO – The Plan
November 9th 1965, New York City and areas with over 30 million people and 80,000 square miles miles of civilization underwent an electricity black out of epic consequence. The city was without power for an unprecedented 13 hours. Heavy investigation into the circumstances traced to a single point of failure – a safety relay that tripped as programmed. The relay opened the line disrupting power because of the heavy demand signal. Unfortunately the load was a “normal” albeit extensive load on the line due only to heavy usage from deep cold, and not the catastrophic power surge it was designed to prevent. A waterfall of effects followed as the excessive load now shot to other re-directed lines, likewise shutting them down.
This interconnected network poignantly was created in order to prevent blackouts instead of beget the proliferation of overload trips. Also of note were the exceptions – numerous “islands” were able to escape the blackout via having the right off/on switches. Staten Island and parts of Brooklyn evaded the effects when people with quick thinking disconnected them from the grid before the programming shut them down.
It’s complicated
The TWO dimension problem is complicated but not complex. Complicated is likened to a tangled set of corded earbuds that you pull out of the backpack. Always wadded into an artistic nest, it takes a minute or so to unravel, but then the cords are “laying flat.” The power loss wasn’t lack of energy but the distribution and safety systems in place. The solution was derived from unraveling the knot of the issue to an ah-ha moment. The plan works but it’s not perfect.
The TWO dimension problem is characterized and best recognized by its product – a PLAN. This is the lion’s share of today’s active problem solving. Two dimension thinking works best/most with complicated but not complex problems. If you can press down the frayed and curled edges of the PLAN, the map is “laying flat” and everyone can read the landscape and follow the directions. The map nails down points of interest and position and context and perhaps some texture. “The map” in your organization is a powerpoint brief or spreadsheet or POAM (Plan of Action and Milestones) or a policy document or any of a plethora of business planning products.
One of many challenges with The Plan is its limitations for capturing the situation. Most often it appears dumbed down to make it actionable, but accordingly, it is ignorantly sourced.
Flattening the curve for COVID-19 was quintessential decision making within the plane. Positive cases and death counts tempered against healthcare resources of bedspace and ventilators were used to forecast the ability to handle ill patients. The data points told us something. The goal became keeping the numbers from exploding. The desired effect was keeping hospital resources from being overwhelmed. The public centered on those numbers, weighing success and failure from the daily counts.
The numbers were scalar. They didn’t address the defiance within gradients of symptoms or effect of measures put in place. It didn’t include testing practices or policy or most poignantly, data sources for the efficacy of all of the above. The data most assuredly had considerable variation and instability (better known as “noise” in data talk); however, the numbers became ground truth – firm footing for taking next steps. The reality is those numbers can never explain the effects. The numbers were mistaken proof of themselves instead of the reality of complexity which was too difficult to maneuver or provide guidance. (See “Will I die of COVID-19?”)
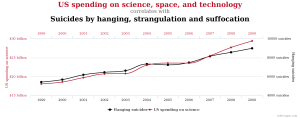
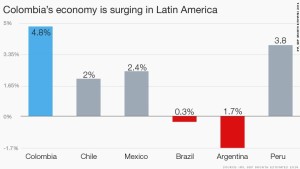
It’s classic causality error. Does US spending on science, space and technology increase suicide occurances?
So causality often uses numbers for quantifying things that are a bit fuzzy. But when is it causality or its misunderstood cousin – correlation? This graph represents a strong correlation between US spending on science and technology and an increase in suicide by strangulation. A strong correlation does not mean that financing more STEM leads to more suicides. That’s the difference between correlation and causality, a fine line we are able to appreciate given an obvious scenario.
Looks like a dead give away. We can save lives and dollars by cutting resources to the favored STEM programs. This is an OBVIOUS example of representation of data that shouldn’t plan anything but a casual remark of “interesting.” When data sets are not so obvious and life and death are on the line – as with COVID-19 – it is hopefully easy to see how important understanding data interpretation is to global pandemic response. Like a smooth talking salesman, the “truth” can be manipulated.
Lots of buts
This TWO dimension of decision space is where the law of averages and linear thinking nestle in and take over. Laying flat nurtures a confidence in comprehending the problem and the expected solution – that may or may not be reality. It inspires conviction in the linear logic of IF>THEN. Causality is the greatest desire and yet the most elusive truth. If bee stings or certain foods or situations cause an allergic reaction, then avoiding it prevents the pain. if you stick your finger in an electric socket, it’s going to shock you (or kill you depending on the socket.) Got it.
Then you slide toward more generalized IF/THens. These have subtle rules embedded in their sequence. If you wear your seatbelt, you have a better chance of surviving an accident, but seatbelts don’t ensure survival. If you complete a college education, will you make more money? Most likely, but not absolutely and the increase in college debts makes the uphill climb more monumental. And that logic doesn’t apply to Bill Gates and Steve Jobs (among a sometimes surprising list of stellar dropouts). Most laws and policy follow this gradient of IF/THEN. Whatever is generally good for one or for most is applied to support the greater good.
Drunk drivers come in all ages; however, raising the drinking age has had a lasting impact in reducing alcohol related car fatalities. Turning 21 years old doesn’t have a miraculous ah-ha moment of responsibility but eighteen year olds collectively and decidedly do not.
Then there’s plenty of insanely simple and wrong examples of causality. If a woman floats, she must be a witch; otherwise, she drowns. If everywhere you look is flat, then the world must be flat and sailing too far into the sunset risks falling off. We may be more “enlightened” now but we apply the same logic with today’s issues. COVID-19 included.
Normally we would
The law of averages is another deeply ingrained mindset within TWO dimension. We tend to lace over design with the bulge of the bell curve, regardless of its application to the situation. The previous examples are just a couple of ways that outliers foul the comfort of “average.”
The natural setting though is often nonlinearity. Logarithmic, power, and exponential relationships are the prevalence of many phenomena. These are “tipping point” behaviours and seemingly sudden or unexpected permutations – exactly what bites when you are thinking linearly.
It’s very comfortable in the map but the real world will never become the representation we create. Wishful linear thinking and projected norms are not reality. Breaking this plane of thinking takes training, tools and systems that support the non-linear, chaotic world that is constantly surprising us with its bends and tricks.
Getting to the next dimension is critical to utilizing the data capabilities at hand as well as those evolving. Let’s go there now.
THREE – Out of the plane and into the fire
The THREE dimension solution set pulls out of the plane and tackles complexity. Wherein complicated can be untangled, complexity problems do not lay flat. The variables continuously morph, pressing in or fading out of contention for individual or shared interest. With complexity, the set of earphones would change length or separate and reattach (or not) or switch color or stretch/compress; other people would be trying to fix them for their benefit and your detriment (or not.) Complexity isn’t just a problem with too many moving parts; complexity players and events enter and exit the problem space with disparate probability sets of their own. The plan can never be laid on a table and “flattened,” such as traffic and nature and happiness. Or global pandemic.
The THREE dimension problem can be bounded, but the space is vastly larger and boundary control is a variable of itself. Suspending the system for evaluation does little to preclude the participation of influencing factors. Like slicing an integral to examine an instance, freezing traffic for a moment or an hour or any time increment does only little to dilute its effect or understand the issues. Just as a road construction project creates a suite of ill effects to be mitigated, bringing economies to near all-stop has consequences too. We plan for such a stoppage with road construction but it doesn’t prevent the need for repairs in the first place, nor the resulting pile ups that will happen when it is underway.
The leverage in understanding traffic is within the flow – a vector quantity of magnitude and direction. Traffic doesn’t cease to exist because more information defines and tracks it. You don’t solve traffic so much as assuage its effects. Big Data learns to avoid or go around traffic if possible. That flow itself inserts influence on the problem set.
Boundary lines
To give a simple visualization of a complex problem, consider the systems engineering example of air conditioning a space. A box is created to make a comfortable space for some creature to inhabit (and possibly WFH). It has walls and ceiling and floor to contain the desired temperature, but it also needs a door – for food and water and mental relief and other assorted desirable bodily needs. How does air conditioning it work? How much energy is needed to sustain the effort? What state is necessary to survive or to thrive? Like the 3 little pigs, will it be made of straw or sticks or bricks? Who’s going to pay for it?
Will the walls be thick or thin? Wherein, no insulation permeates heat, insulating a room to even extremes still subjects the contents to weather because it exists on earth that has variable weather. Think about it. The more the problem is mitigated only increases its dependence, in this case – on the weather. Trying to “control” the weather only makes the problem more subject to it. The internal condition is influenced by the external conditions.
This case also visualizes the boundary passage aspect. Physically entering and leaving is necessary for utilizing the space; otherwise, why have the space? Air flow must pass the boundary as well for the heat exchange necessary to maintain the desirable temperature and utilization of the space. And there will be inefficiencies, waste, and slippage.
Note too that this example is “solvable” – with a given tolerance. I can set the control to 74 degrees. The “answer” is an easily established and visualized integer representing a desirable outcome. There are several feedback loops but making a decision, such as putting the thermostat at 74, establishes a policy that will not be instantaneous. The effect depends upon the system working as anticipated within a certain time period. That may or may not happen depending upon the physical operation capabilities of the system and the less measurable patience of the participants. Is there sufficient funding and engineering to design, build and then maintain that solution?
Although a solution set of options attends the problem, the solution sets are multi-dimensioned. Each has time, cost, risk and opportunity in addition to width and depth of variables. The matrix likely has gray strata of pros and cons, at least some of which are subjective. If the desired state is comfortable living conditions, does “74 degrees Fahrenheit” maximize that accomplishment? Other variables are pressing. How great a variance is tolerable, detrimental, disastrous?
What It Takes
Solving a problem or preventing a disaster in three dimensions has several important components. First, there’s never a stasis. Entities as well as the influencers and structures are fluid, and not necessarily predictable or linear or normalized. The solution space has volume and does not remain within a plane; it is unlikely to become flat. If it does, the moment is measured but not enduring.
Studying three dimension problems is about utilizing vector quantities to appreciate the flows. The solution set is subjective measurement with associated tolerances, costs, and risks. “Acceptable” is both subjective and variable, although it can be measured and visualized.
Finally, the THREE dimension problem has to be comfortable with the gray and oh-so fuzzy in order to attain desirable effects. “74” is a number attached to a goal, but it’s not the end state. “74-ish” likely describes its acquiescence to variables observed or mitigated.
The next dimension pops out of the box.
FOUR – A Stitch in TIme
The morning of September 8th, 1900, was a mild, partly cloudy day, with beach dwellers lingering to enjoy the surf of Galveston, Texas. The peaceful day was disrupted by a local weather forecaster on horseback riding the streets sounding the alarm of impending disaster. Whether they heeded his warning or not, the day was the first of several days unloading all the hurricane forces feared. Most fateful was a tidal surge of over 15 feet, easily covering the entire island’s paltry 8 feet above sea level. Buildings simply floated off their foundations and crashed like bumper cars into other buildings. The death toll of 6000-10000 lives still remains the worst fatal US natural disaster.
Like perhaps all disasters, there were signs and signals that were either ignored or denied or incorrectly interpreted or promulgated. Data points indicated potential hurricane capability, but sparity of sources and lack of communication left them adrift to be tossed in the consuming waters. The local forecasters actually broke policy by announcing the impending hurricane disaster, which dictated that warnings could only be broadcast with national center blessing. The reparation is decades of research and reform and refinement developing some of the most sophisticated forecasting and modeling on the planet – hurricane tracking.
Predicting hurricanes is not like finding out today’s chance of precipitation. It requires a suite of forecasting tools. First, the atmosphere movement is captured via supercomputer dynamical modeling. Then hIstorical models consume all the behaviors of past hurricanes to project active storm potential. Add to that trajectory models that focus solely on predicting the eye over land and ground. A slate of surge, wave and wind models each work to predict the variety of storm forces. Statistical-dynamic models encompass the influence of those two types. Finally ensemble forecasts incorporate a suite of models.
Multiple approaches utilize different but sometimes overlapping data sets to tackle pieces to the puzzle. Only the most powerful tools can even attempt to consummate the results. For now too, trying to put all the factors together for a comprehensive picture is likely to dilute accuracy from the parts. We’re still not there yet.
Where the rigor meets the road
The result of using multiple models with competing and converging resources and reasons is the FOUR dimension problem space – building the plane as it flies – working all the issues of three dimensions in the reality of the march of time while handling injections and nonlinearity. The solution set for the four dimension problem is another integration up. Whereas the THREE dimension problem captures complexity, this dimension captures the lags and leaps of acceleration and unknowns.
Four dimensions is where the issue is most closely mapped to the territory. The models have fidelity and tangency and vibration. The result is never a “map” and surely, the body and edges never lay flat. The potency is vigilance, iteration, and constant tweaking of all the resources available. The boundary flickers and moves.
Modeling is rigor. Creating the model, especially in four dimension, exacts a deliberation in understanding the facets and facilities surrounding a problem as well as potential solutions. Only through this work can the intricacies and complexity be fathomed. The model itself becomes a talking point – an opportunity to share and critique. A model engages players and encourages interaction. The model extracts data from the Big Data world. It incorporates the “corporate knowledge” of its keepers, and it manipulates the interpretations, which are multiple and varied for most likely and most deadly. Taskings evolve from the model and return to add to its color and texture.
Get it
This is the essence of Big Data problem solving – humans leveraging knowledge through technology. It extends the Industrial Age to the Information Age and keeps going. This bridge from possible to actual is delicate and yet formidable.
It’s delicate because building the best modeled problem does not necessarily offer the most ideal solutions. Models are representations of the world – or the portion thereof that we want to control or correct or predict – but they are not reality. “Confusing the map for the territory” is a siren to which all humans are drawn. It is primal behavior. The model will never be reality though. Models are tools for working a problem. Recreating a problem set to exacting proportions results in . . . another world to manage. Plus, being humans integral to the system itself, artificial intelligence development has proven we add our own delusions through bias and conscious and subconscious interpretation.
That doesn’t mean it’s useless; it’s the algebra that needs to be done. And by algebra, I mean it’s the math not enough people can do. The FOUR dimension problem is the real world and it’s really, really messy. It’s full of noise, non-linearity, and sensitivity to initial conditions. The four dimension problem is where testing reality lies. We probably can’t solve problems in the four dimension with today’s science, technology and resources but this dimension is the evolution or perhaps quantum leap toward that capability. All problem solving isn’t about recreating the situation but manipulating it for desirable effects.
“You can’t navigate well in an interconnected, feedback-dominated world unless you take your eyes off short-term events and look for long-term behavior and structure; unless you are aware of false boundaries and bounded rationality; unless you take into account limiting factors, nonlinearities and delays. You are likely to mistreat, misdesign, or misread systems if you don’t respect their properties of resilience, self-organization, and hierarchy.”
It could be argued all problems exist in the FOUR dimension because time affects us all whether we recognize its influence or not. Not all problems though need the special effects of FOUR dimension. Some problems may recur or morph slightly over time; the risk and return of the solution though does not vary sufficiently to warrant FOUR dimension analysis.
This dimension also ventures to see the edge of chaos. Greater complexity systems study actually reveals that strategic intuition often pushes the lever the wrong direction from the desired outcome. Studying FOUR dimension problems and models is about trial and error and observation.
∑ – In the End
The answer is there is no answer. Not ONE like we want it to be. But we need to keep evolving with the Big Data world.
These four dimensions are hardly the best definition of problem solving. Many, many more academics can slice and dice and better explain the logistics and psychology of how and why attack an issue but this book will return to the factor that we are making small data decisions in a Big Data world.
Breaking down problem space into dimensions demonstrates at what level we are currently stuck as well as the potential of stepping up a dimension. The tools and systems we use now are based upon training and education with small data interpretation. Realizing the next dimension has greater insight and better prediction capability is a template for designing new tools and systems that do solve the more complicated and complex problems that can be tackled with Big Data.
It’s not just a cool factor of utilizing emerging technology. Big Data is necessary for solving the problems of a Big Data world. We had to stop the world to stop a pandemic. We can count positive cases and recoveries and deaths, but that doesn’t portend the effects of economic impact. These numbers shape the iceberg as seen from the surface. The impact of hunger, substance abuse, unemployment, depression, and less apparent “excess” death rates are under the water.
Using those numbers is valuable for comprising algorithms and assessments for short and long term reverberations. Those numbers in combination with other Big Data sources can build scenarios for rebuilding and resurgence. What if this pandemic or the next one was much worse?
The Navigator’s Balls
So let’s consider the ancient mariners. Four thousand years before Christ, seafaring souls took to crossing waters while hugging the shoreline. A couple thousand years later, they used the stars and developed tools to create maps. (Yah, I totally believe it would take hundreds of years of staring at the stars to figure out how to navigate by them.) The two-dimension problem – here to there – was to facilitate commerce. They risked because the reward was financial. But predicting the weather over the horizon – that was the gods’ will.
Going back a couple hundred years to the sailing days of Columbus, they didn’t know the world was round, but they could use the very crude data of falling barometric pressure to appreciate weather not yet seen. They didn’t understand exactly why but falling pressure meant prepare for the worst. Not an easy signal to find but once discovered, they knew the consequences. We need to figure out Big Data barometry.
Big data and its solutions are not going to look like what we have been doing or the type of results we have gotten. Today we have very sophisticated means to predict the weather – supercomputers and Big Data – but although the local forecast is usually close, it’s rarely 100%. As the forecast stretches further out into the future, it becomes less and less accurate. That’s the world of chaos and a whole additional elephant in the room that comes later.
So, there’s a lot of room for opportunity to grow, which is a nice way of saying we fall short of a lot of ways to solve problems. When 95% of the world we have yet to understand, solutions are raison d’etre. Life exists in understanding our world and marveling at the accomplishments of our creator – whomever you choose. Einstein quipped that if given an hour to solve a problem, he would spend 55 minutes studying the problem before 5 minutes of conjuring solutions.
The call to action with this book though is the data world is amassing information much more ominously than we are adapting to using its power. When we still use small data tools in a Big Data world, it’s bringing a knife to a gun fight.
Next we will explore what it takes to break the plane. These new decision spaces demand things we are not used to needing or accepting while creating a solution. Then we will dive into the triad of tools, training and systems that are needed to implement Big Data solving Big Problems