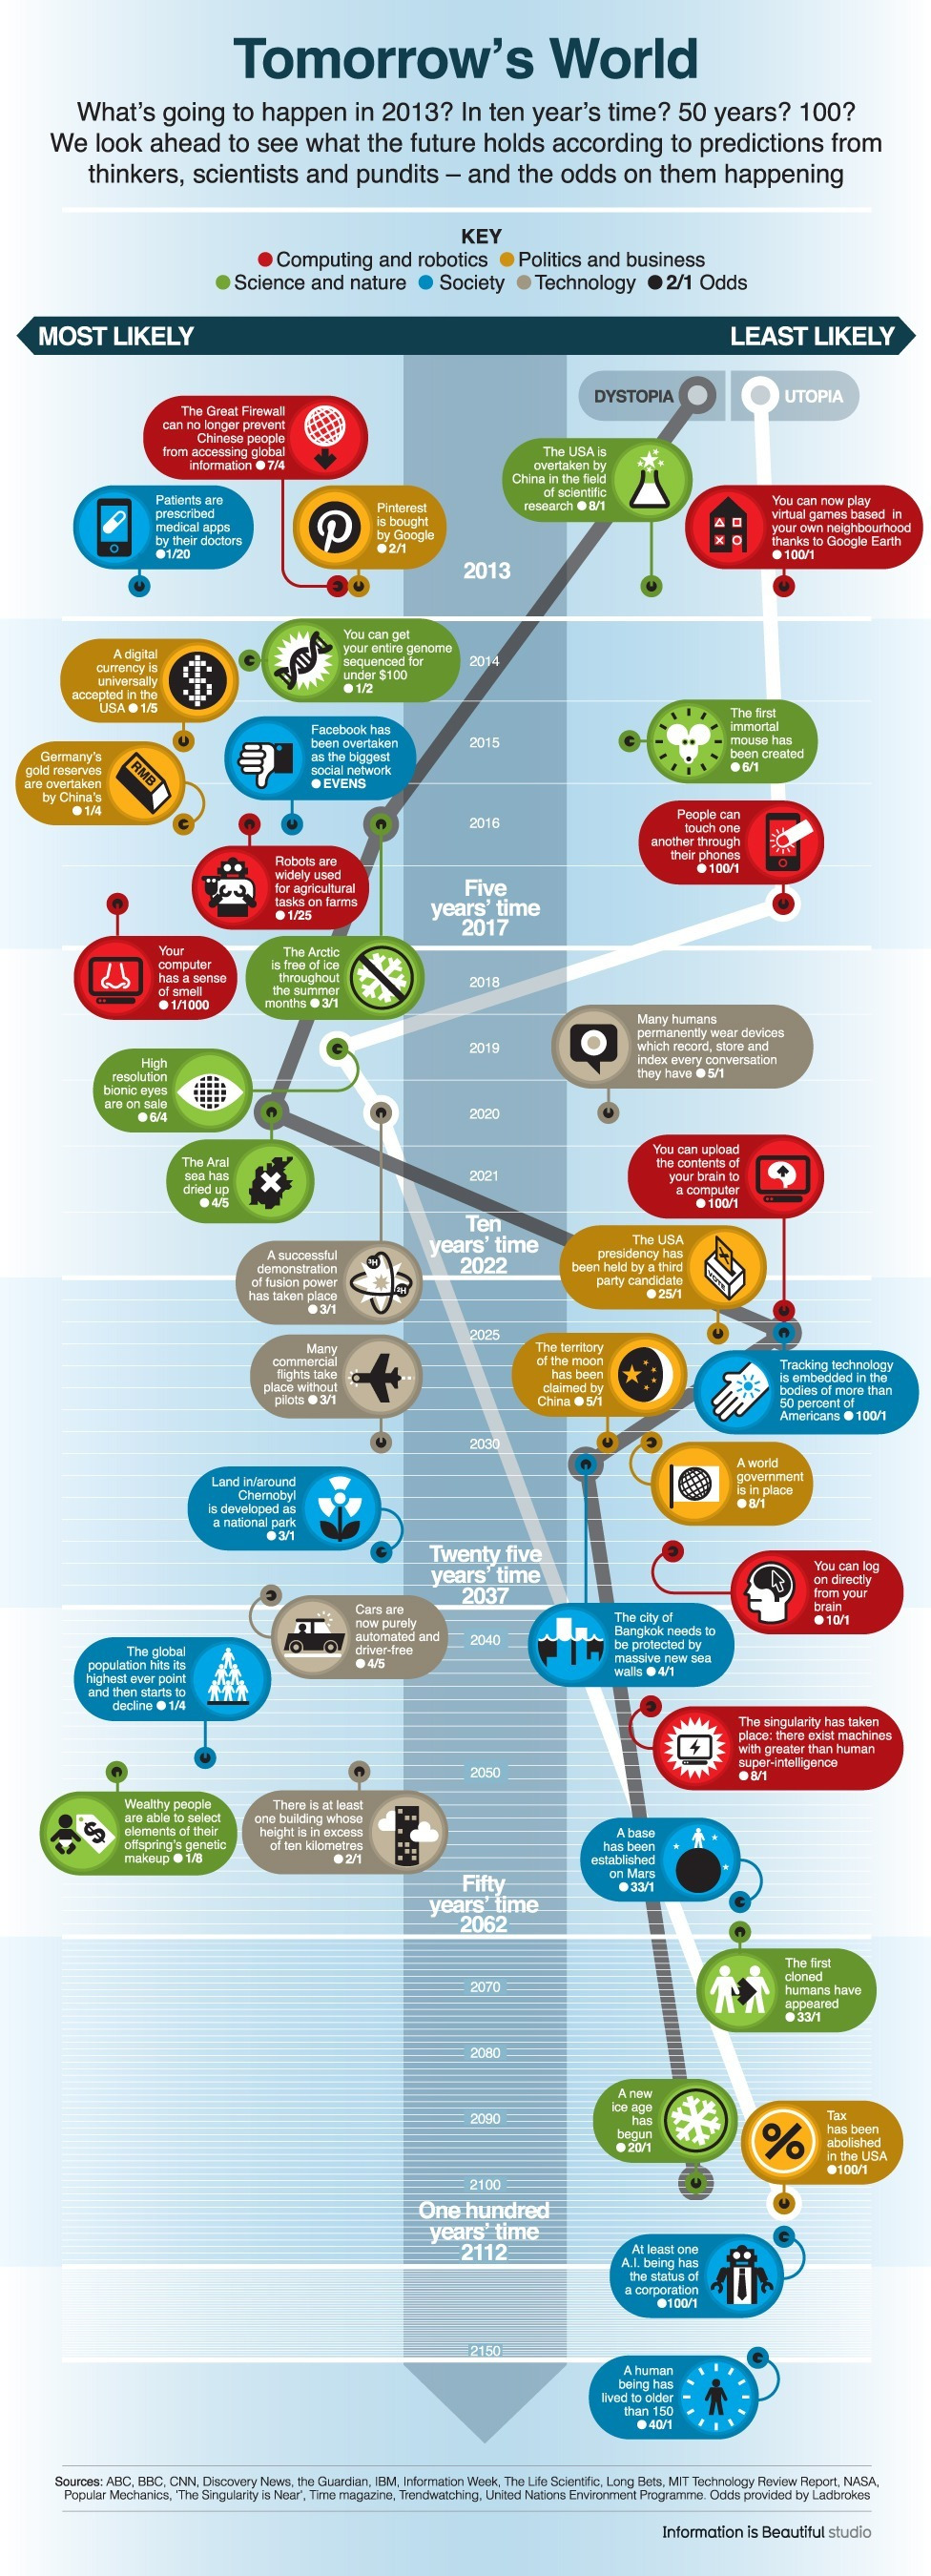
Ahhhh … to see into the future. Makes me wish I’d bought Google at $10, if it even started that low. I would’ve bet a […] Read More
Big Data Solving Big Problems
Ahhhh … to see into the future. Makes me wish I’d bought Google at $10, if it even started that low. I would’ve bet a […] Read More
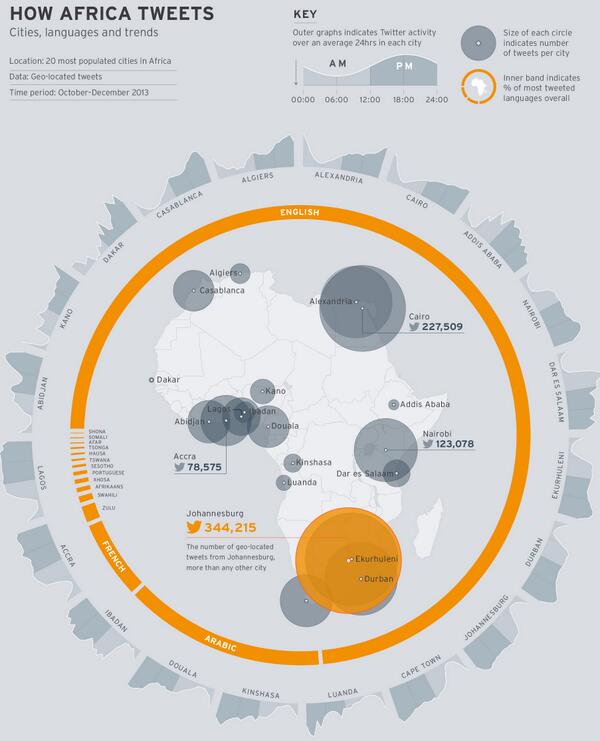
Twitter graphic on how Africa tweets

Info graphic for elephant conservation utilizing Big Data. Follow up to Elephant(s) in the Room – Just How Many Are There?
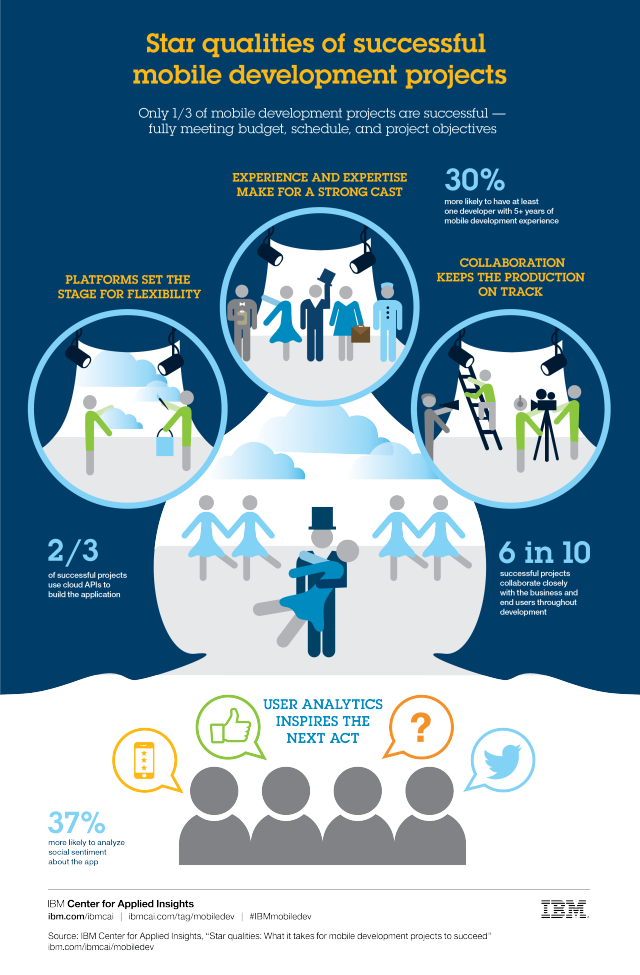
IBM provides a pitiful info graphic on successful mobile app projects. Developer Economics provides a much more robust insight to what people want to know about mobile app development.
Final Thoughts on Big Data Body Sizing Concept.
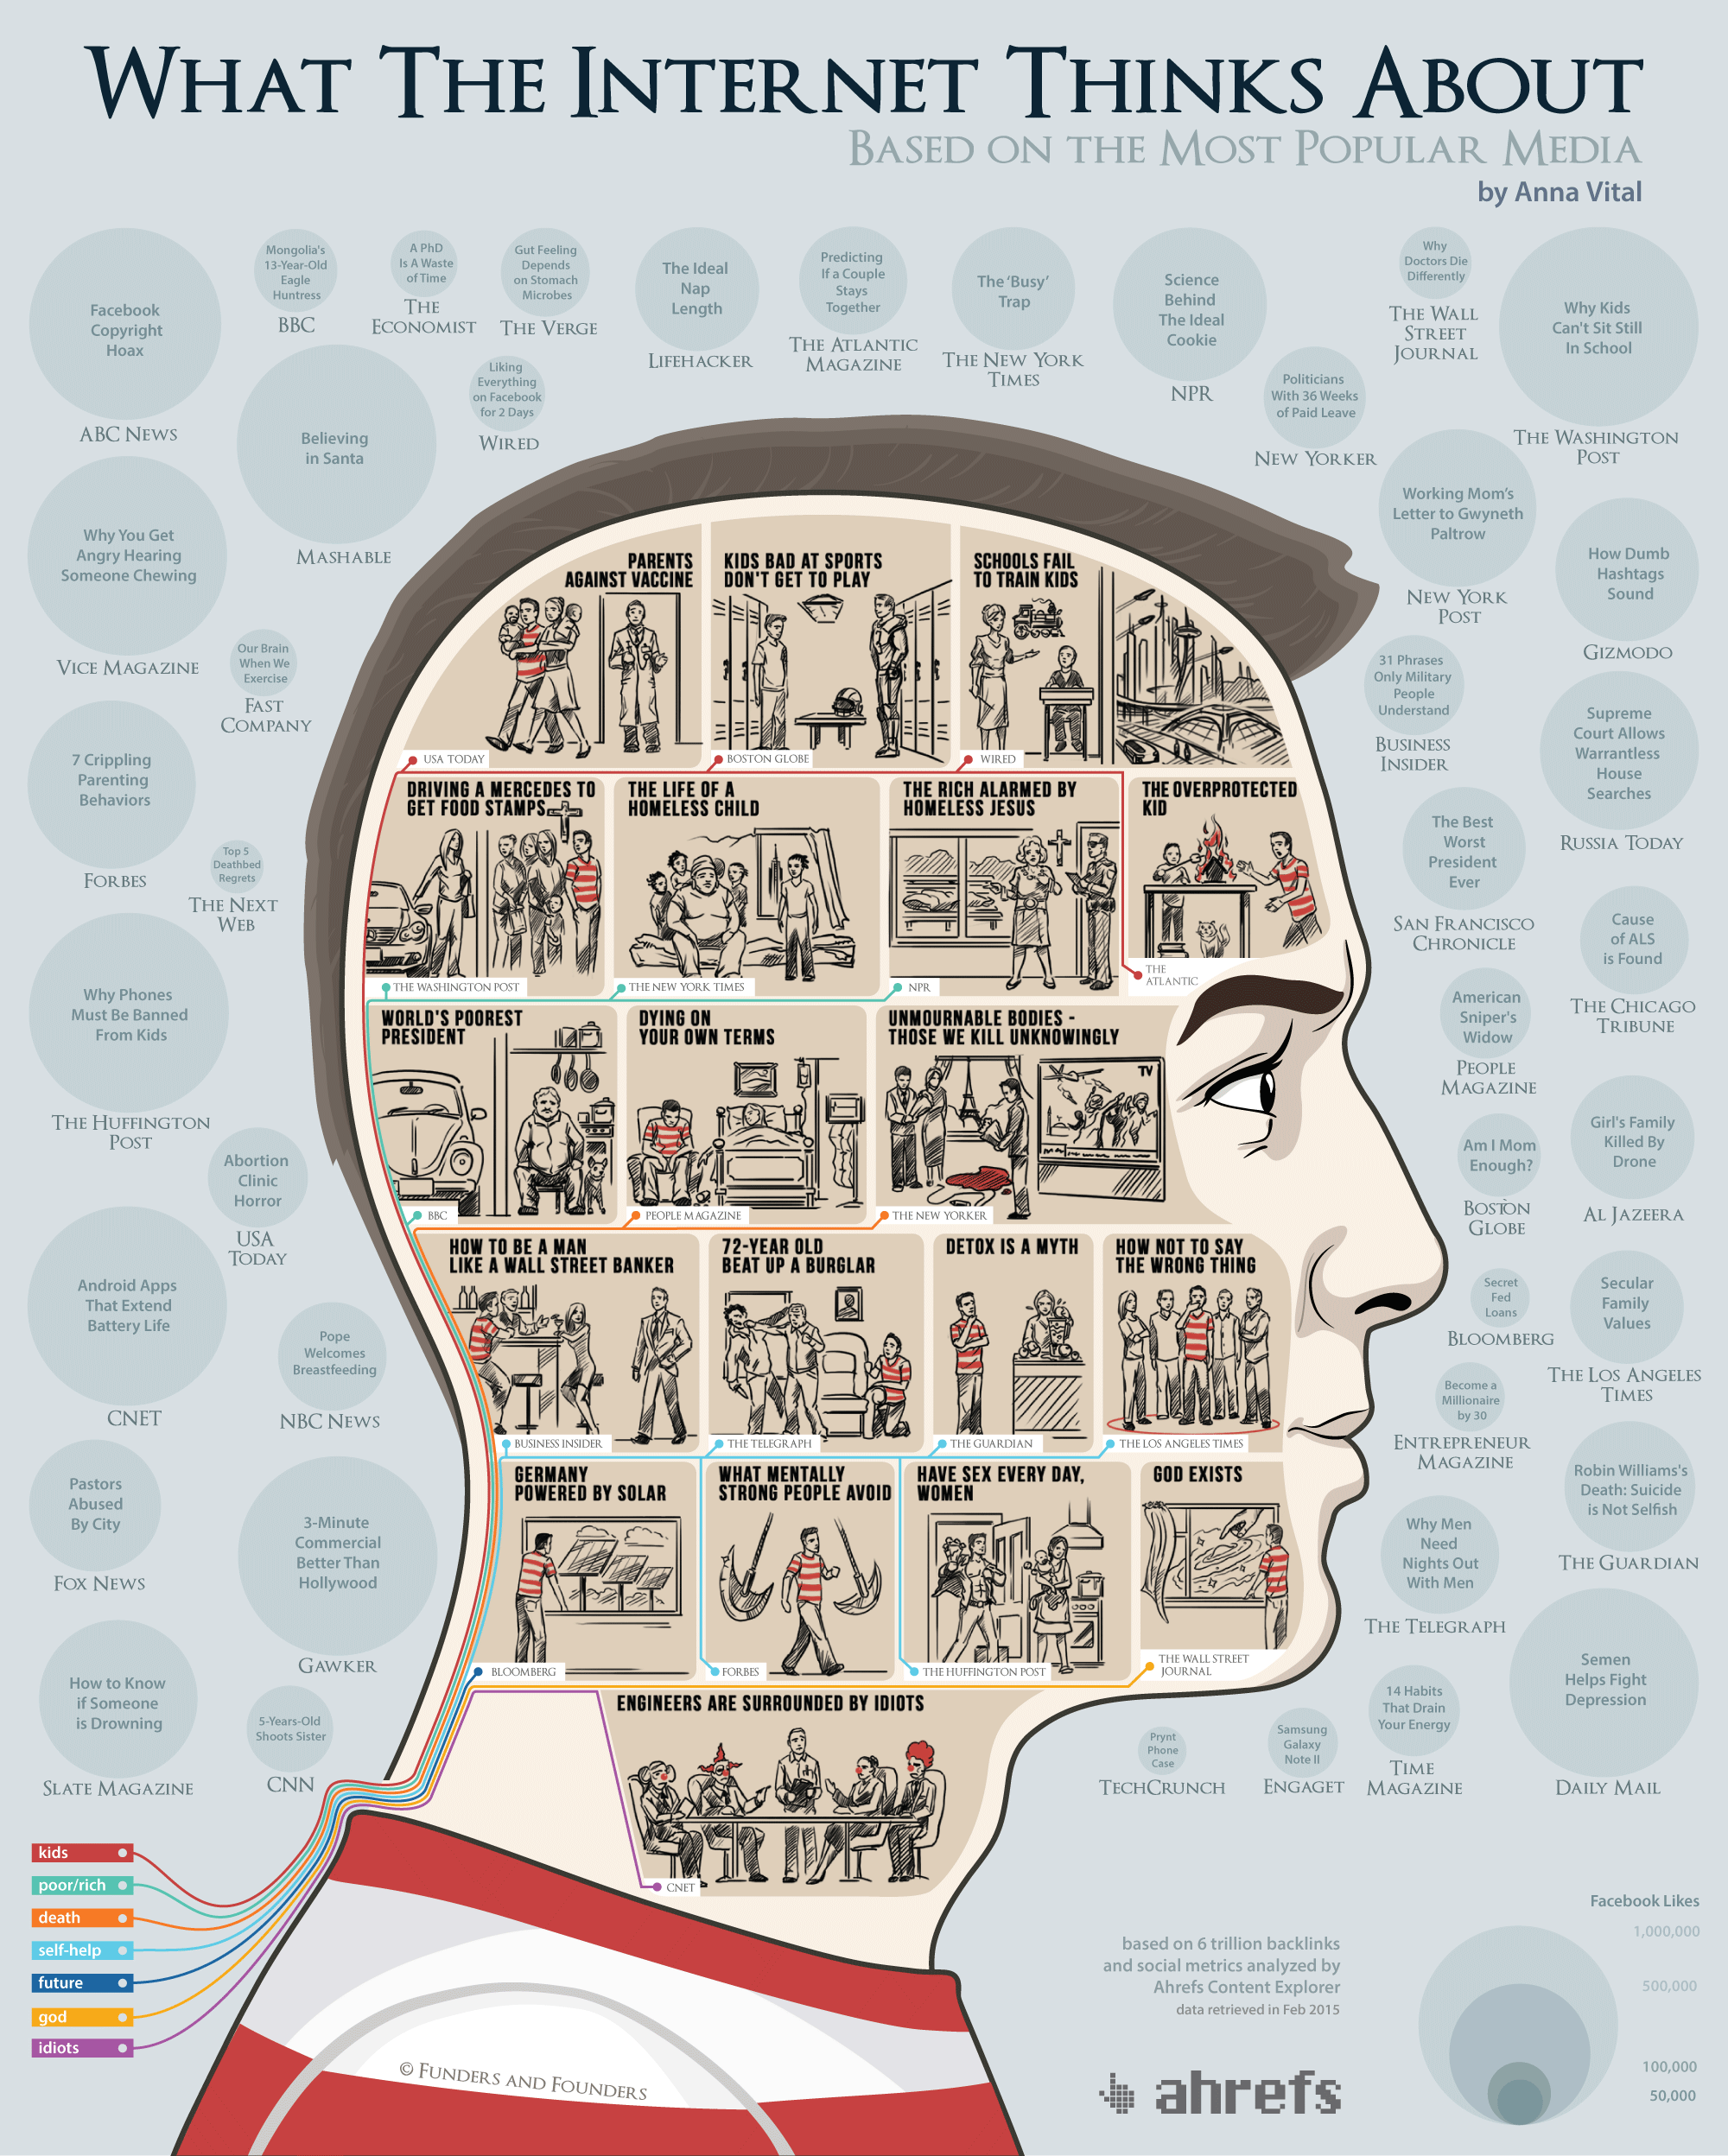
Anna Vital of Funders and Founders created an interactive info graphic of top media stories.
Datafloq infographic on Big Data and the Internet of Things (IoT).
Better Decision Making Capability by Exercising Data Skepticism Jeffrey Heer explores how better data visualization tools create better questions and better decision making capability.
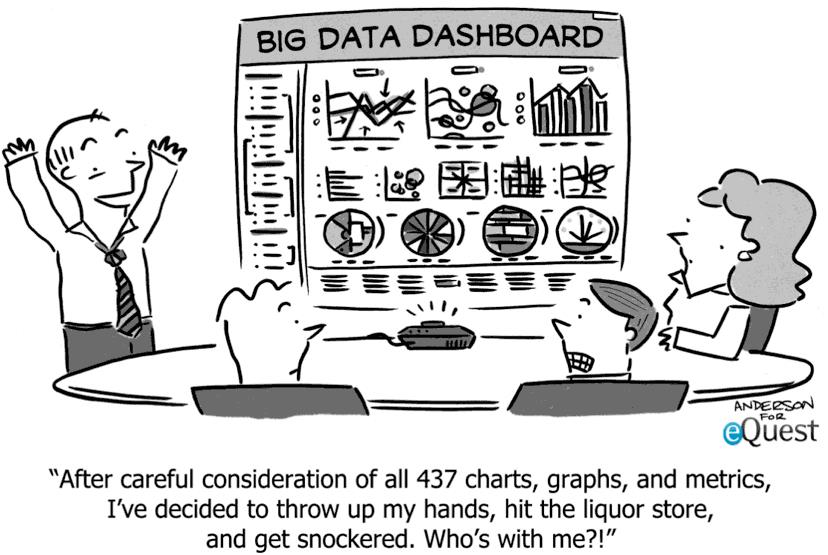
Big Data Decision Making Funny Cartoon
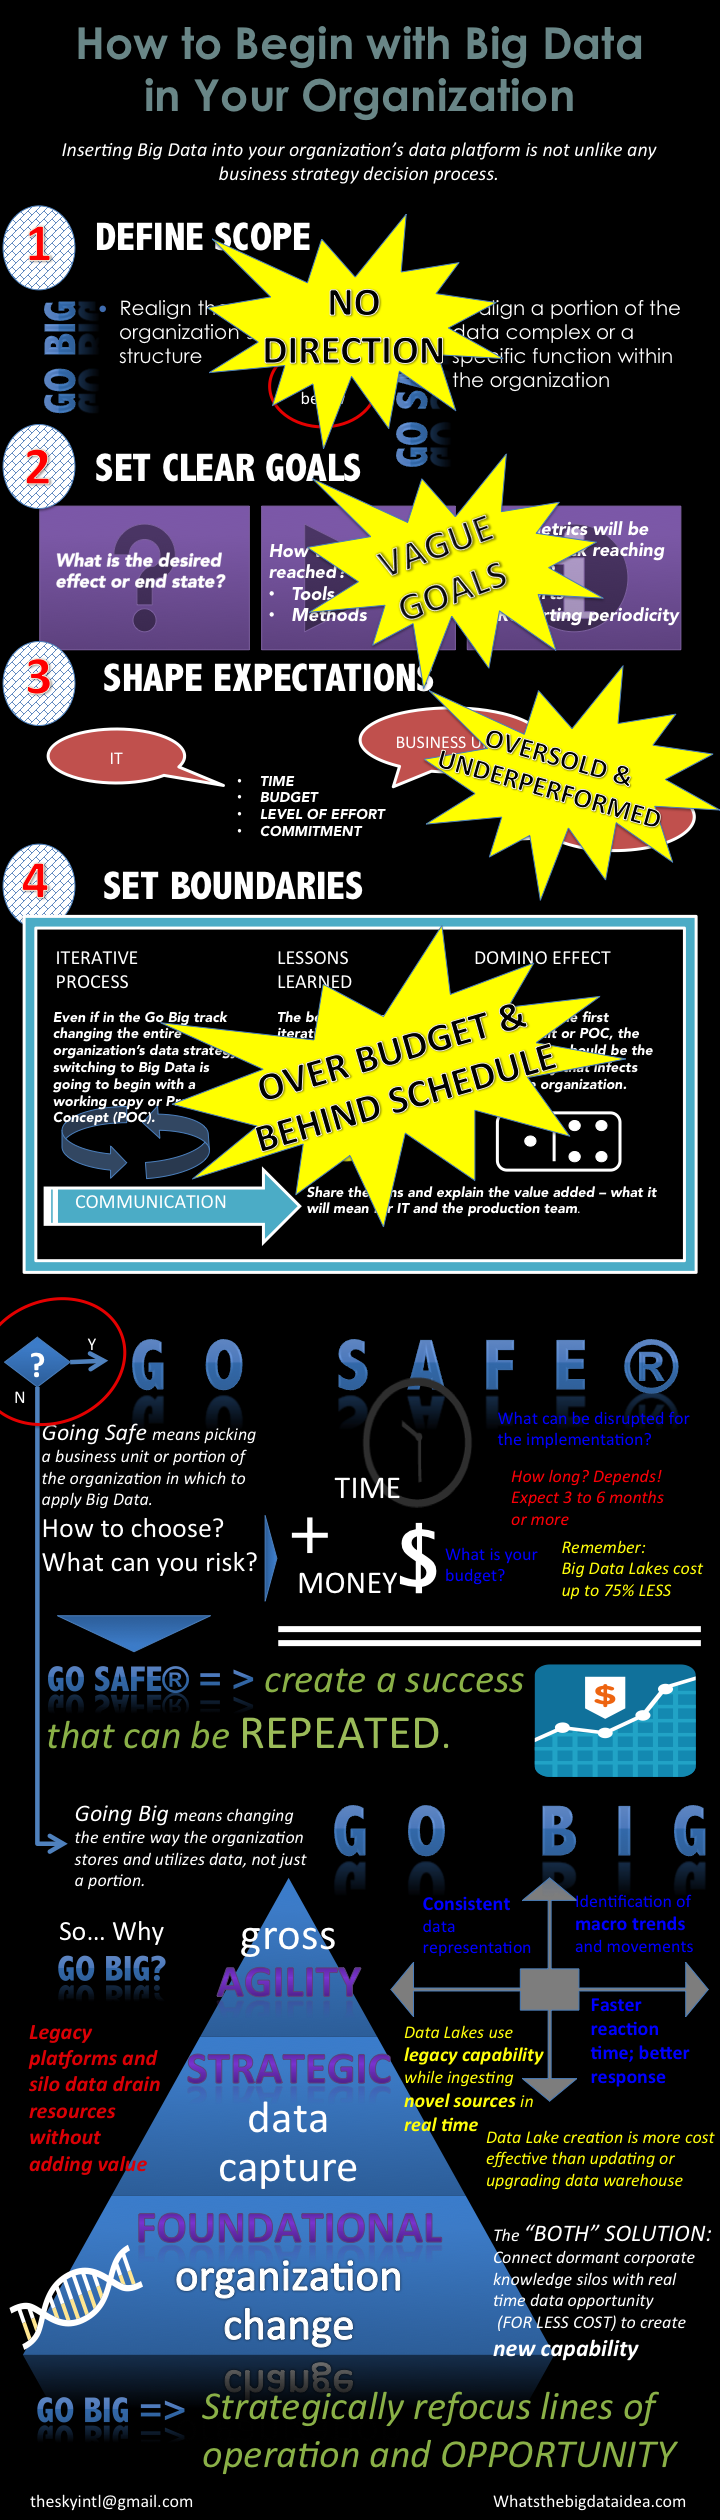
4 Top Reasons Big Data Implementation Projects Fail